crime
crime
* based on official police data
Safety Is Your Right
“The right of the people to be secure in their persons, houses, papers, and effects” — the Fourth Amendment to the U.S. Constitution expresses a principle of personal security that extends to everyday movement through a city. In New York, conditions can vary not only between neighborhoods but within them, making broad labels insufficient for evaluating local differences in recorded crime. This map provides a structured way to view official statistics at a finer spatial level, helping users compare areas when considering where to stay, live, or walk.
Understanding Street-Level Safety Across New York City
New York is a dense and dynamic environment where conditions may change significantly from block to block. This independent project, developed by Anthony Nick (Independent Analytics Lab), uses official data from NYC Open Data (NYPD Complaint Data) to visualise recorded crime patterns at street level. The objective is to present a clearer, more granular view of how incidents are distributed across the city.
While official datasets are publicly available, they are often presented in aggregated forms or as anonymised point data without sufficient spatial structure for comparison. This implementation organises the data into a consistent analytical framework to highlight local variation and support more precise comparisons across areas.
Why Existing Police Data Views Are Not Enough
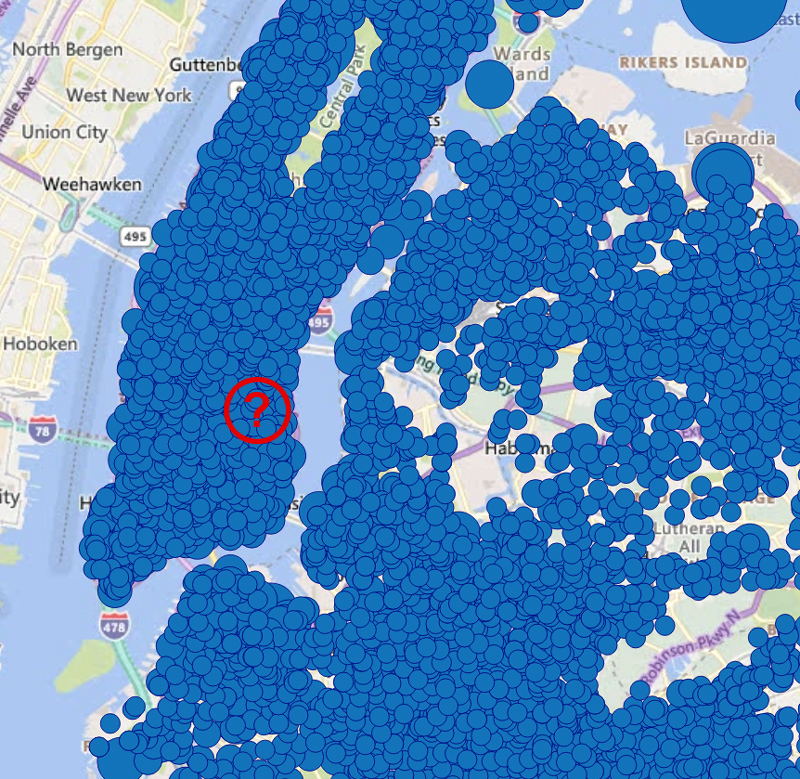
The official NYPD map displays raw incident points without any geographic aggregation or severity weighting - meaning 100 pickpocketings appear identical to 100 violent assaults, and there are no tools to assess overall crime levels for a neighborhood or to compare two districts side by side.
Try the official NYPD crime map
 .
.
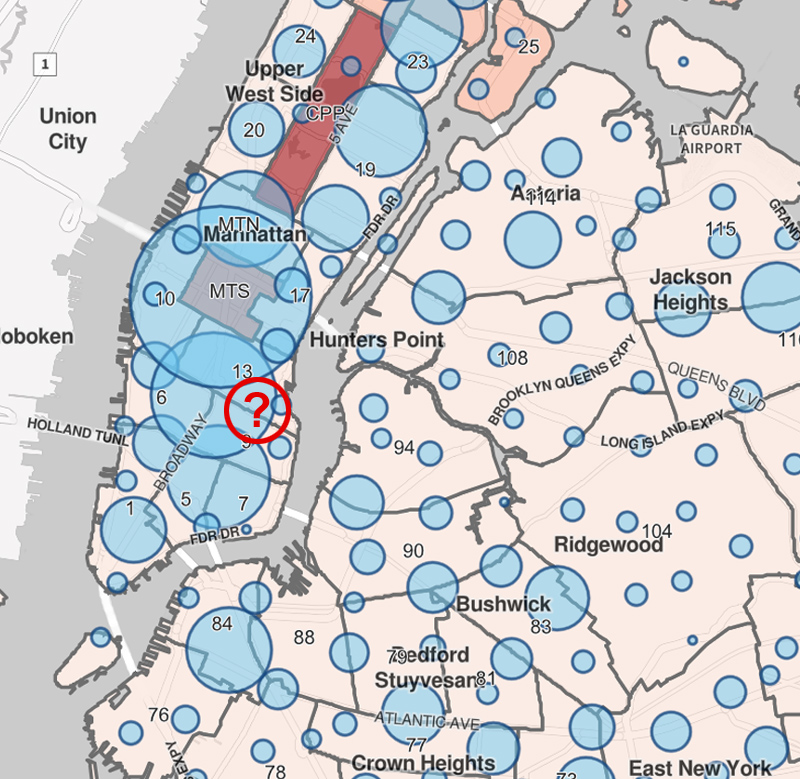
The NYC OTI map, meanwhile, clusters incident points into large blue circles that often overlap streets and blocks to which the clusters no longer geographically correspond. It also offers a precinct-level heatmap, but the color scale is deliberately flattened so that all precincts appear statistically similar regardless of actual incident counts. Moreover, incidents are normalized by resident population per 1,000 people - a metric that wildly distorts reality, making Central Park appear among the "most dangerous" areas simply because very few people live there.
Try the official NYC OTI crime map
How to Use the Map
The interactive map allows users to explore crime distribution across New York City at street level. Selecting a grid block reveals underlying incident data, while filtering options allow users to isolate specific categories of offences and observe spatial patterns. At higher zoom levels, anonymised incident points provide additional context.
Hotel markers are displayed for reference only; selecting a marker redirects to the hotel’s official website. The map does not classify locations as safe or unsafe — it provides a comparative analytical view of recorded crime density to support independent evaluation of different areas.
Local Crime Level: A 0.3 x 0.3 mi Analytical Grid
New York City is divided into uniform 0.3 x 0.3 mi (500 × 500 m) Grid Blocks. Within each block, police-recorded incidents are aggregated and weighted by severity to produce a Local Crime Level — a density-based indicator representing the relative concentration of street-level crime.
The analysis includes offences relevant to public-space exposure such as theft, robbery, assault, and other street-related incidents. Each category is assigned a severity coefficient (1–10) based on an independent analytical model reflecting relative seriousness. These weights are not official risk ratings but a methodological tool used to introduce a severity dimension into the comparison.
Normalising incident counts by grid area allows meaningful comparison between locations of different sizes and densities. As a result, neighbouring blocks within the same neighbourhood can exhibit substantially different Local Crime Level values, reflecting how unevenly recorded incidents are distributed across the city.
Transparent, Lawful, Independent
All data is sourced from official NYC Open Data (NYPD Complaint Data) published under applicable open data policies. Only records with usable spatial coordinates are included; data with restricted or anonymised locations is excluded. No private surveillance or commercial datasets are used.
The full methodology — including data selection, spatial grid construction, severity weighting, normalisation, and aggregation — is documented on the Legal & Methodology page. Data handling follows applicable data protection and public data usage guidelines.
Comprehensive Disclaimer
This platform visualises historical police records and does not provide real-time monitoring, predictive assessment, or guarantees of safety. Local Crime Level values are comparative indicators and must not be interpreted as absolute measures of risk. Lower values do not guarantee safety, and higher values do not imply that incidents will occur. A low number of police‑recorded incidents in a given area may indicate either a genuinely low level of danger for visitors or simply that residents of that area are less likely to report incidents to the police. A high level of recorded incidents in a given area justifies increased attentiveness when moving through that environment.
The map is intended as an analytical tool for spatial awareness and comparative analysis. Users remain responsible for their own decisions regarding travel, movement, accommodation, and property-related considerations. It should be used alongside other sources of information and local context.